Company: FTS International
Symbol: FTS
Description: FTS International is an independent provider of oil and natural gas well stimulation services with expertise in high-pressure hydraulic fracturing.
Shares: 15.2 million
Price Range: $15.00-$18.00
Trade Date: 2/2
Underwriter(s): Credit Suisse, Morgan Stanley
Co Manager(s): Wells Fargo, Barclays, Citigroup, Evercore ISI, Guggenheim Securities, Simmons & Co., Tudor Pickering Holt, Cowen and Company
Terms Added: 1-23-18
2/1/18 Update: New Amendment: Share Size Increased to 19.5mm
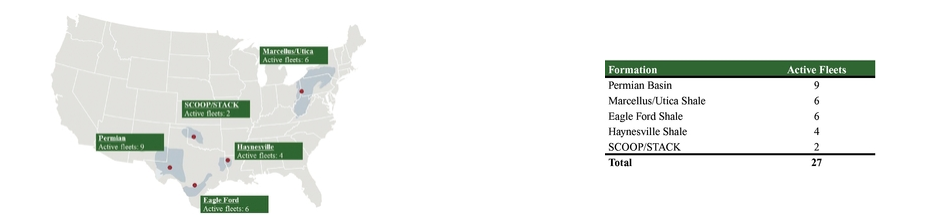
Business: They are one of the top three hydraulic fracturing providers across their operating footprint, which consists of five of the most active major unconventional basins in the United States: the Permian Basin, the SCOOP/STACK Formation, the Marcellus/Utica Shale, the Eagle Ford Shale and the Haynesville Shale. Their customers include Chesapeake Energy Corporation, ConocoPhillips, Devon Energy Corporation, EOG Resources, Inc., Diamondback Energy Inc., EQT Company, Range Resources Corporation, and other leading E&P companies that specialize in unconventional oil and natural gas resources in North America. They have 1.6 million total hydraulic horsepower across 32 fleets, with 27 fleets active as of January 8, 2018. From December 31, 2010 to January 8, 2018, they have completed more than 163,000 fracturing stages across five of the most active major unconventional basins in the United States. This history gives them valuable experience and operational capabilities at the leading edge of horizontal well completions in unconventional formations. As one of the largest hydraulic fracturing service providers in North America, they believe they are well positioned to capitalize on the recovery of the North American oil and natural gas exploration and production market.
The following map shows the basins in which they operate and the number of fleets operated from each basin as of January 8, 2018.
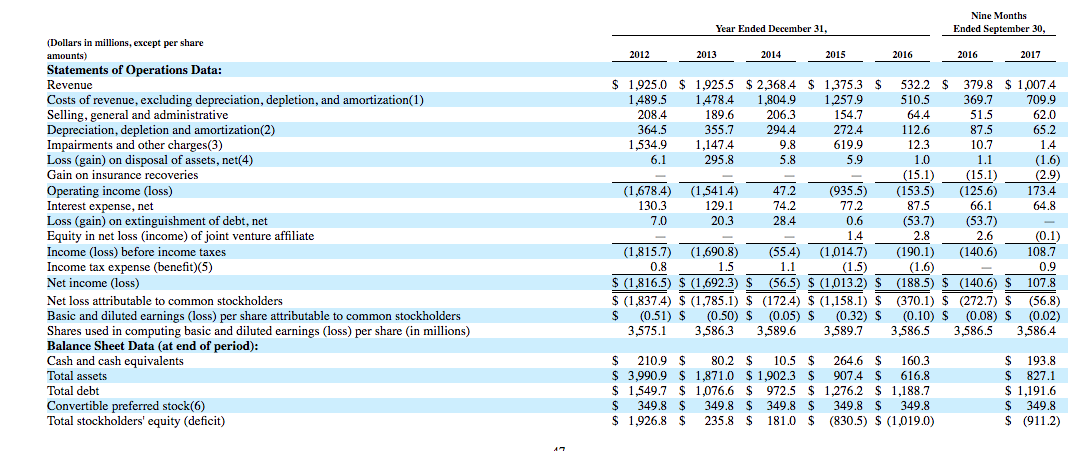
Financials: Their revenue was $1.93 billion, $1.93 billion, $2.37 billion, $1.38 billion, and $532 million, and their net losses were $1.82 billion, $1.69 billion, $56.5 million, $1.01 billion and $188.5 million in 2012, 2013, 2014, 2015, and 2016, respectively. In the first three quarters of 2017, their revenue increased 165% to $1.01 billion, while their net increased from a $140.6 million loss to a $107.8 million gain.
Book-Building Status: The way the book comes together during the week of the roadshow is the most critical indicator to first-day and first-week performance. IPO Boutique uses its 45 years of experience and sources all over the street to gather daily subscription levels, specific price guidance and what type of investors are currently in the book or are anchoring orders in the book. In addition, recent underwriter performance on sector specific deals is a strong factor that IPO Boutique takes into account when determining if our clients should indicate for any offering.
IPO Boutique subscription clients receive daily updates on this critical information.
Conclusion: IPO Boutique provides ratings, daily commentary and a forecast for how this IPO will open vs. its offering price. We have kept a track record with our performance for last 12 years at our website. Additionally, here’s a 2017 recap of our performance to showcase the value of IPO Boutique’s service.
Indicate with confidence, SUBSCRIBE today.