
We begin our statistical review of the 2015 calendar year with our annual, statistical review of how the underwriters fared. Included in the graphic below is the underwriter’s performance among deals they were book-runners on. We have cut the list down to include underwriters who participated as main book-runners in 10 or more deals for 2015.
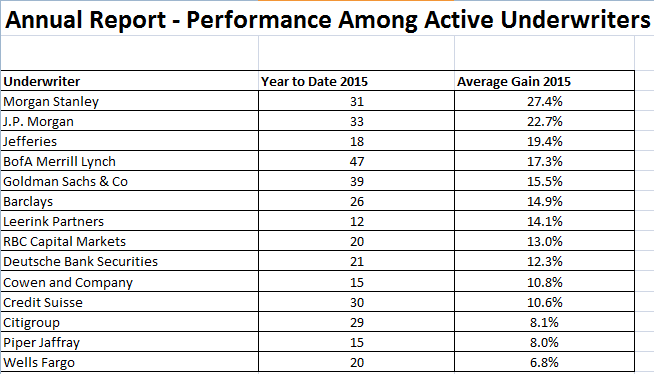
Morgan Stanley led the way in performance. They were really boosted by a strong first half of the year where they were on 17 deals that produced a 34% return above the offering price at first trade. The only other underwriter with a year-to-date performance of 20% or more above the offering price at first trade is J.P. Morgan. Their 33 deals produced a 22.7% return for their clients. J.P. Morgan had an even better success rate before a weaker fourth quarter where they saw its deals return just 9.7% above the offering price.
In terms of quantity of deals underwritten in 2015, BoA Merrill Lynch leads the way with 47 deals with Goldman Sachs & Co not far behind with 39.
Below is an entire list of underwriter performance for the fourth quarter and year.
| Quarterly Report – 4th Quarter (October 1, 2015-December 31, 2015) | ||||
| Underwriter | Deals 4Q | YTD Deals | Average Gain 4Q | Average Gain 2015 |
| Aegis Capital | 0 | 2 | N/A | 0.0% |
| Allen & Co. | 2 | 2 | 5.5% | 5.5% |
| Axiom Capital Management | 0 | 1 | N/A | 0.0% |
| Baird | 1 | 6 | 7.0% | 12.0% |
| Barclays | 7 | 26 | 6.6% | 14.9% |
| BB&T Capital | 0 | 1 | N/A | 0.0% |
| BMO Capital Markets | 4 | 8 | 7.8% | 4.9% |
| BNP PARIBAS | 1 | 1 | 13.0% | 13.0% |
| BofA Merrill Lynch | 7 | 47 | 7.4% | 17.3% |
| Burnham Securities | 1 | 1 | 3.0% | 3.0% |
| Canaccord Genuity | 0 | 1 | N/A | 1.0% |
| Chardan Capital Markets | 0 | 2 | N/A | 0.0% |
| China Renaissance | 1 | 2 | 0.0% | 2.0% |
| CIBC | 1 | 1 | 10.0% | 10.0% |
| Citigroup | 7 | 29 | 2.0% | 8.1% |
| Cowen and Company | 4 | 15 | 13.0% | 10.8% |
| Credit Agricole | 0 | 1 | N/A | 0.0% |
| Credit Suisse | 5 | 30 | 3.6% | 10.6% |
| D.A. Davidson & Co. | 0 | 1 | N/A | 9.0% |
| Deutsche Bank Securities | 5 | 21 | 3.6% | 12.3% |
| Evercore ISI | 1 | 5 | -8.0% | 4.8% |
| FBR | 1 | 2 | -13.0% | -6.5% |
| Goldman Sachs & Co | 9 | 39 | 7.2% | 15.5% |
| HSBC | 1 | 1 | 2.0% | 2.0% |
| J.P. Morgan | 3 | 33 | 9.7% | 22.7% |
| Jefferies | 8 | 18 | 11.4% | 19.4% |
| Keefe Bruyette & Woods | 1 | 4 | 8.0% | 14.0% |
| KeyBanc Capital Markets | 0 | 1 | N/A | 40.0% |
| KKR | 1 | 1 | 2.0% | 2.0% |
| Ladenburg Thalmann & Co. | 1 | 2 | 0.0% | 5.5% |
| Laidlaw & Company | 0 | 1 | N/A | 6.0% |
| Leerink Partners | 3 | 12 | 5.3% | 14.1% |
| Macquarie Capital | 0 | 1 | N/A | 2.0% |
| Maxim Group | 1 | 3 | 1.0% | -3.7% |
| Mizuho Securities | 1 | 1 | 2.0% | 2.0% |
| Morgan Stanley | 7 | 31 | 8.0% | 27.4% |
| National Securities Corporation | 0 | 1 | N/A | 30.0% |
| Needham & Co., | 2 | 2 | 6.0% | 6.0% |
| Network 1 Financial Securities | 1 | 1 | 3.0% | 3.0% |
| Nomura | 1 | 3 | 8.0% | 2.7% |
| Northland Capital Markets | 0 | 1 | N/A | 0.0% |
| Oppenheimer & Co., | 1 | 1 | 12.0% | 12.0% |
| Pacific Crest Securities | 0 | 1 | N/A | -4.0% |
| Piper Jaffray | 1 | 15 | 8.0% | 8.0% |
| PNC Capital Markets | 1 | 1 | 2.0% | 2.0% |
| Raymond James | 2 | 6 | -2.5% | 0.0% |
| RBC Capital Markets | 3 | 20 | 7.0% | 13.0% |
| Roth Capital Partners | 0 | 2 | N/A | 21.5% |
| Sandler O’ Neill Partners | 0 | 3 | N/A | 10.3% |
| Scotia Howard Weil | 0 | 1 | N/A | 0.0% |
| Stephens Inc | 2 | 2 | 7.5% | 8.0% |
| Sterne Agee | 0 | 2 | N/A | 2.0% |
| Stifel | 1 | 8 | 24.0% | 3.0% |
| Sun Trust Robinson Humphrey | 1 | 6 | 2.0% | 8.7% |
| The Huntington Investment Company | 0 | 1 | N/A | 0.0% |
| UBS Investment Group | 1 | 8 | 15.0% | 9.8% |
| ViewTrade Securities | 0 | 1 | N/A | 0.0% |
| Wedbush PacGrow | 1 | 1 | 8.0% | 8.0% |
| Wells Fargo | 3 | 20 | -0.3% | 6.8% |
| William Blair | 1 | 3 | 8.0% | 20.0% |
| WR Hambrecht + Co. | 0 | 1 | N/A | 21.0% |
| Wunderlich Securities | 0 | 1 | N/A | 0.0% |